 |
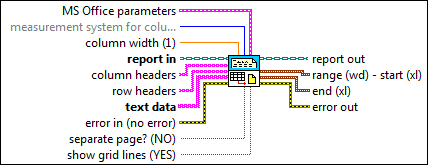
MS Office parameters (Report Generation Toolkit) specifies the point in a Microsoft Word or Excel report where you want an insertion to occur. The VI ignores this input for HTML reports. You can specify a bookmark in Word or a named range or cell coordinates in Excel. If you set the report type to Word but do not specify a bookmark, the insertion occurs at the end of the document.
 |
position contains the row and column coordinates of the point in an Excel worksheet from which the insertion occurs. Row and column values in Excel are zero-based, so the row and column coordinates of (0,0) correspond to cell A1.
 |
rows specifies the row index.
|
 |
columns specifies the column index.
|
|
 |
name contains the name of the cell in a Microsoft Excel worksheet from which the insertion occurs.
|
 |
bookmark contains the name of the bookmark in a Word document from which the insertion occurs.
|
|
 |
measurement system for column width determines whether the value you enter in column width is in inches or centimeters. The VI ignores this parameter for HTML reports.
| 0 | US—Sets the column width in inches. | | 1 | Metric—Sets the column width in centimeters. | | 2 | Default (default)—Sets the column width in the measurement system set up on the computer. |
|
 |
column width defines the width of each column in the report table. The value you enter must be in inches or centimeters, depending on the settings you enter in measurement system for column width. The default is 1. For HTML reports, the VI multiplies the value by 100 to set the column width in pixels.
 | Note If you set column width to a large value and send several columns of data to the VI, the VI automatically resizes the column width to fit the width of the report on a single page. If you are using a template and do not want the column width to vary, use the value -1. |
|
 |
report in is a reference to the report whose appearance, data, and printing you want to control. Use the Create Report VI to generate this LabVIEW class object.
|
 |
column headers determines how each column is labeled in the table.
|
 |
row headers determines how each row is labeled in the table.
|
 |
text data is the information you want to be printed in tabular form. If you are using a table control, pass the table's value to this parameter.
|
 |
error in describes error conditions that occur before this node runs. This input provides standard error in functionality.
|
 |
separate page? specifies whether to place the table on a new page of the report. The default is FALSE.
|
 |
show grid lines specifies whether to display the grid lines of the table. The default is TRUE.
|
 |
report out is a reference to the report whose appearance, data, and printing you want to control. You can wire this output to other Report Generation VIs.
|
 |
range (wd) - start (xl) (Report Generation Toolkit) indicates the place where the VI inserts the table.
 |
start (wd) - row (xl) is the point where the table begins.
|
 |
end (wd) - col (xl) is the point where the table ends.
|
|
 |
end (xl) (Report Generation Toolkit) indicates the last cell in the Excel worksheet where the VI inserts the table.
 |
row (xl) is the row number where the table ends.
|
 |
col (xl) is the column number where the table ends.
|
|
 |
error out contains error information. This output provides standard error out functionality.
|
 |
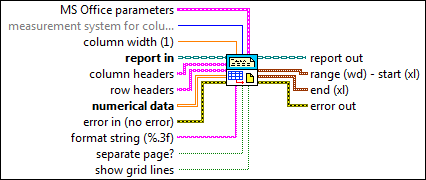
MS Office parameters (Report Generation Toolkit) specifies the point in a Microsoft Word or Excel report where you want an insertion to occur. The VI ignores this input for HTML reports. You can specify a bookmark in Word or a named range or cell coordinates in Excel. If you set the report type to Word but do not specify a bookmark, the insertion occurs at the end of the document.
 |
position contains the row and column coordinates of the point in an Excel worksheet from which the insertion occurs. Row and column values in Excel are zero-based, so the row and column coordinates of (0,0) correspond to cell A1.
 |
rows specifies the row index.
|
 |
columns specifies the column index.
|
|
 |
name contains the name of the cell in a Microsoft Excel worksheet from which the insertion occurs.
|
 |
bookmark contains the name of the bookmark in a Word document from which the insertion occurs.
|
|
 |
measurement system for column width determines whether the value you enter in column width is in inches or centimeters. The VI ignores this parameter for HTML reports.
| 0 | US—Sets the column width in inches. | | 1 | Metric—Sets the column width in centimeters. | | 2 | Default (default)—Sets the column width in the measurement system set up on the computer. |
|
 |
column width defines the width of each column in the report table. The value you enter must be in inches or centimeters, depending on the settings you enter in measurement system for column width. The default is 1. For HTML reports, the VI multiplies the value by 100 to set the column width in pixels.
 | Note If you set column width to a large value and send several columns of data to the VI, the VI automatically resizes the column width to fit the width of the report on a single page. If you are using a template and do not want the column width to vary, use the value -1. |
|
 |
report in is a reference to the report whose appearance, data, and printing you want to control. Use the Create Report VI to generate this LabVIEW class object.
|
 |
column headers determines how each column is labeled in the table.
|
 |
row headers determines how each row is labeled in the table.
|
 |
numerical data is the numerical information included in the table. The information must be a 2D array.
|
 |
error in describes error conditions that occur before this node runs. This input provides standard error in functionality.
|
 |
format string specifies the number formatting to use when converting the numbers to characters. The default is %.3f. Use the format string syntax.
|
 |
separate page? specifies whether to place the table on a new page of the report. The default is FALSE.
|
 |
show grid lines specifies whether to display the grid lines of the table. The default is TRUE.
|
 |
report out is a reference to the report whose appearance, data, and printing you want to control. You can wire this output to other Report Generation VIs.
|
 |
range (wd) - start (xl) (Report Generation Toolkit) indicates the place where the VI inserts the table.
 |
start (wd) - row (xl) is the point where the table begins.
|
 |
end (wd) - col (xl) is the point where the table ends.
|
|
 |
end (xl) (Report Generation Toolkit) indicates the last cell in the Excel worksheet where the VI inserts the table.
 |
row (xl) is the row number where the table ends.
|
 |
col (xl) is the column number where the table ends.
|
|
 |
error out contains error information. This output provides standard error out functionality.
|
 Add to the block diagram
 Find on the palette


