 |
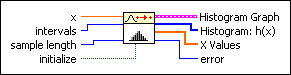
x is an input data point.
|
 |
intervals specifies the number of intervals, or bins, to use in the histogram and must be greater than 0. If intervals is less than or equal to 0, the histogram is undefined, and the VI sets Histogram: h(X) and X Values to empty arrays and returns an error. The default is 10.
|
|
sample length is the length of each set of incoming data. The VI performs computation for each set of data. The default is 100. sample length must be greater than zero.
|
 |
initialize, when TRUE, initializes the internal state of the VI.
|
 |
Histogram Graph displays the bar graph of the histogram of the input sequence x. The y-axis is the histogram count, and the x-axis is the histogram center values of the intervals (bins) of the histogram.
|
 |
Histogram: h(x) is the discrete histogram computed from the set of input data points specified by sample length.
|
 |
X Values is an array of the center values of the interval (bin) of the histogram.
|
 |
error returns any error or warning from the VI. You can wire error to the Error Cluster From Error Code VI to convert the error code or warning into an error cluster.
|

 Add to the block diagram
 Find on the palette