 |
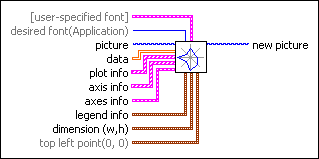
[user-specified font] specifies the specific font characteristics for the text to draw. The VI ignores this input unless desired font is User-specified Font.
 |
Font Name specifies the font to use for the text. If you misspell the font name or specify a font that is not installed on the computer, the operating system selects a font.
|
 |
Size specifies the size of the font in points.
|
 |
Strikeout? specifies if the text appears in strikeout. If Strikeout? is TRUE, the text appears in strikeout.
|
 |
Italic? specifies if the text appears in italics. If Italic? is TRUE, the text appears in italics.
|
 |
Underline? specifies if the text is underlined. If Underline? is TRUE, the text appears underlined.
|
 |
Outline? specifies if the text is outlined. If Outline? is TRUE, the text appears outlined.
|
 |
Shadow? specifies if the text has a shadow. If Shadow? is TRUE, the text appears in shadow.
|
 |
Bold? specifies if the text is bold. If Bold? is TRUE, the text appears bold.
|
|
 |
desired font specifies the text font.
| 0 | User-specified Font | | 1 | Application Font (default) | | 2 | System Font | | 3 | Dialog Font |
|
 |
picture is the picture to which you want to add the plot. The default is an empty picture.
|
 |
data is a 2D array, where each row represents a plot. The VI draws each index in a plot on a corresponding y-scale. A straight line connects all the points in a plot.
|
 |
plot info specifies the name, color, and fill option for each plot. The index of this array matches the row index in data.
The VI uses plot name and plot color for the legend.
 |
plot name is the name of the plot.
|
 |
plot color is the color of the plot. The default in RGB is white.
You can wire a color box constant to this input.
|
 |
fill? specifies whether to fill the interior. If FALSE (default), the VI draws only the outlines.
|
|
 |
axis info specifies the label (name) of each y-axis and the minimum and maximum value of each y-axis. The index of this array matches the column index in data.
 |
label is the label of the y-axis.
|
 |
max value is the maximum value of the y-axis.
|
 |
min value is the minimum value of the y-axis.
|
|
 |
axes info specifies the color, format and precision of the y-axes, and whether to autoscale the y-axes.
 |
color is the color for all the y-axes. The default in RGB is 255, 255, 255.
You can wire a color box constant to this input.
|
 |
autoscale? specifies whether to autoscale each y-axis independently. If FALSE (default), the VI does not autoscale each y-axis.
|
 |
format and precision specifies the format of the values on the y-axes.
 |
format specifies the numeric format for the scale numbers.
| 0 | Decimal | | 1 | Scientific | | 2 | Engineering | | 3 | Binary | | 4 | Octal | | 5 | Hex |
|
 |
precision specifies the precision for the scale numbers. The default is 1.
|
|
|
 |
legend info specifies the location of the plot legend relative to the radar plot.
 |
position specifies where to draw the legend.
| 0 | None (default)—The VI does not draw the legend. | | 1 | Top | | 2 | Right | | 3 | Bottom | | 4 | Left |
|
 |
text color is the color of the labels of the y-axes, as shown in the legend. The default in RGB is 255, 255, 255.
You can wire a color box constant to this input.
|
|
 |
dimension (w,h) specifies the rectangle in coordinates into which the VI draws the radar plot and legend.
 |
Width is the horizontal coordinate that increases to the right.
|
 |
Height is the vertical coordinate that increases to the bottom.
|
|
 |
top left point specifies in coordinates where to place the top-left corner of the image in the new picture.
 |
x is the horizontal coordinate that increases to the right.
|
 |
y is the vertical coordinate that increases to the bottom.
|
|
 |
new picture is the picture that contains the plot. You can wire this output to any other picture input to add more drawing instructions to the picture. You also can wire this output to the Picture to Pixmap VI to obtain an image data cluster. You then can save the image data to a file using the Graphics Formats VIs.
|

 Add to the block diagram
 Find on the palette


