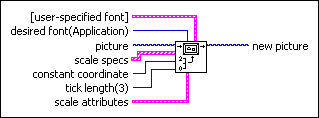
Draw Scale VI
Owning Palette: Picture Plots VIs
Requires: Base Development System
Draws a scale onto a picture.

 Add to the block diagram Add to the block diagram |
 Find on the palette Find on the palette |
Owning Palette: Picture Plots VIs
Requires: Base Development System
Draws a scale onto a picture.

 Add to the block diagram Add to the block diagram |
 Find on the palette Find on the palette |
 |
[user-specified font] specifies the specific font characteristics for the text to draw. The VI ignores this input unless desired font is User-specified Font.
| ||||||||||||||||
 |
desired font specifies the text font.
|
||||||||||||||||
 |
picture is the picture to which you want to add the scale. The default is an empty picture. | ||||||||||||||||
 |
scale specs is an array of clusters containing the coordinates and labels you can use in the scale. Use the Calc Scale Specs VI to obtain the values for this input.
| ||||||||||||||||
 |
constant coordinate is the location of the x coordinate in a vertical scale, or the y coordinate in a horizontal scale. | ||||||||||||||||
 |
tick length specifies the length of the tick marks on the edge of the scale. | ||||||||||||||||
 |
scale attributes describes the format for the scale.
| ||||||||||||||||
 |
new picture is the picture that contains the scale. You can wire this output to any other picture input to add more drawing instructions to the picture. You also can wire this output to the Picture to Pixmap VI to obtain an image data cluster. You then can save the image data to a file using the Graphics Formats VIs. |
Refer to the Simple Scale VI in the labview\examples\Graphics and Sound\Picture Plots directory for an example of using the Draw Scale VI.