The discrete implementation of the Fourier transform maps a digital signal into its Fourier series coefficients, or harmonics. Unfortunately, neither a time nor a frequency stamp is directly associated with the FFT operation. Therefore, you must specify the sampling interval Δt.
Because an acquired array of samples represents a progression of equally spaced samples in time, you can determine the corresponding frequency in hertz. The following equation gives the sampling frequency fs for Δt.
fs = 1/Δt
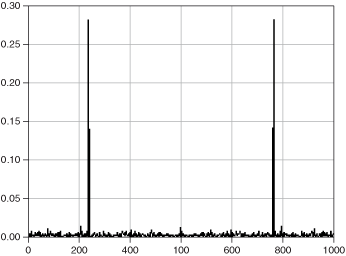
The following figure shows the frequency information from an FFT transform with the sampling interval 1.000E-3.
Two other common ways of presenting frequency information are displaying the DC component in the center and displaying one-sided spectrums.