 |
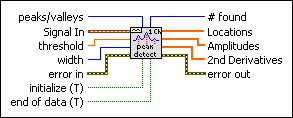
peaks/valleys indicates whether to find peaks or valleys.
|
 |
Signal In contains the waveform in which to find peaks or valleys.
|
 |
threshold instructs the VI to ignore peaks and valleys that are too small. The VI ignores peaks if the fitted amplitude is less than threshold. The VI ignores valleys if the fitted trough is greater than threshold.
|
 |
width specifies the number of consecutive data points to use in the quadratic least squares fit. The value should be no more than about 1/2 of the half-width of the peak/valley and can be much smaller (but > 2) for noise-free data. Large widths can reduce the apparent amplitude of peaks and shift the apparent location. For noisy data, this modification is not important because the noise obscures the actual peak.
|
 |
error in describes error conditions that occur before this node runs. This input provides standard error in functionality.
|
 |
initialize, when TRUE (default), causes the VI to process the first block of data. The VI requires some internal setup that must be done at the start for proper operation.
|
 |
end of data (T), when TRUE (default), causes the VI to process the last block of data. The VI cleans up internal data after the last block has been processed.
|
 |
# found is the number of peaks/valleys found in the current block of data. # found is the size of the arrays Locations, Amplitudes, and 2nd Derivatives.
|
 |
Locations contains the index locations of all peaks or valleys detected in the current block of data. Because the peak detection algorithm uses a quadratic fit to find the peaks, it actually interpolates between the data points. Therefore, the indexes are not integers. In other words, the peaks found are not necessarily actual points in the input data but may be at fractions of an index and at amplitudes not found in the input array.
To view the locations in terms of time, use the following equation.
Time Locations[i] = t0 + dt*Locations[i]
|
 |
Amplitudes contains the amplitudes of peaks or valleys found in the current block of data.  | Note The Locations and Amplitudes might deviate from actual peaks or valleys for noisy signals with large dynamic ranges. |
|
 |
2nd Derivatives gives measurements of the second derivative of the amplitude at each of the peaks or valleys found in the current block of data. 2nd Derivatives gives an approximate measure of the sharpness of each peak or valley. If you are detecting peaks, these values are all negative. If you are detecting valleys, the values are all positive.
 | Note It is assumed that dt, the time difference between samples, is equal to 1. |
|
 |
error out contains error information. This output provides standard error out functionality.
|
 |
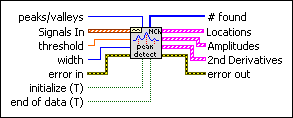
peaks/valleys indicates whether to find peaks or valleys.
|
 |
Signals In contains the waveforms in which to find peaks or valleys.
|
 |
threshold instructs the VI to ignore peaks and valleys that are too small. The VI ignores peaks if the fitted amplitude is less than threshold. The VI ignores valleys if the fitted trough is greater than threshold.
|
 |
width specifies the number of consecutive data points to use in the quadratic least squares fit. The value should be no more than about 1/2 of the half-width of the peak/valley and can be much smaller (but > 2) for noise-free data. Large widths can reduce the apparent amplitude of peaks and shift the apparent location. For noisy data, this modification is not important because the noise obscures the actual peak.
|
 |
error in describes error conditions that occur before this node runs. This input provides standard error in functionality.
|
 |
initialize, when TRUE (default), causes the VI to process the first block of data. The VI requires some internal setup that must be done at the start for proper operation.
|
 |
end of data (T), when TRUE (default), causes the VI to process the last block of data. The VI cleans up internal data after the last block has been processed.
|
 |
# found is the number of peaks/valleys found in the current block of data. # found is the size of the arrays Locations, Amplitudes, and 2nd Derivatives.
|
 |
Locations contains the index locations of all peaks or valleys detected in the current block of data for each waveform.
 |
Locations contains the index locations of all peaks or valleys detected in the current block of data. Because the peak detection algorithm uses a quadratic fit to find the peaks, it actually interpolates between the data points. Therefore, the indexes are not integers. In other words, the peaks found are not necessarily actual points in the input data but may be at fractions of an index and at amplitudes not found in the input array.
To view the locations in terms of time, use the following equation.
Time Locations[i] = t0 + dt*Locations[i]
|
|
 |
Amplitudes contains the amplitudes of peaks or valleys found in the current block of data for each waveform.
 |
Amplitudes contains the amplitudes of peaks or valleys found in the current block of data.  | Note The Locations and Amplitudes might deviate from actual peaks or valleys for noisy signals with large dynamic ranges. |
|
|
 |
2nd Derivatives gives measurements of the second derivative of the amplitude at each of the peaks or valleys found in the current block of data for each waveform.
 |
2nd Derivatives gives measurements of the second derivative of the amplitude at each of the peaks or valleys found in the current block of data. 2nd Derivatives gives an approximate measure of the sharpness of each peak or valley. If you are detecting peaks, these values are all negative. If you are detecting valleys, the values are all positive.
 | Note It is assumed that dt, the time difference between samples, is equal to 1. |
|
|
 |
error out contains error information. This output provides standard error out functionality.
|
 Add to the block diagram
 Find on the palette


