Owning Palette: 3D Graph Properties VIs
Requires: Base Development System (Windows)
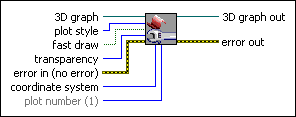
Adjusts various properties of the plot, including the transparency, plot style, and coordinate system.

  Add to the block diagram | 
  Find on the palette | 
![]()  | 
3D graph accepts the reference to the 3D control. | 
![]()  | 
plot style changes the way the data is plotted. The default is a surface plot. | 
![]()  | 
fast draw determines if the surface is redrawn while it is rotated and zoomed or if it is displayed as points of data. | 
![]()  | 
transparency is a value from 0 to 100 that changes the transparency of the plot. | 
![]()  | 
error in describes error conditions that occur before this node runs. This input provides standard error in functionality. | 
![]()  | 
coordinate system can be cwCartesian, cwCylindrical, or cwSpherical. The default is cwCartesian. | 
![]()  | 
plot number is the index into the list of plots from the properties of the 3D control. Add new plots by right-clicking the control and adjusting the properties. The default is the first plot from the list. | 
![]()  | 
3D graph out passes the reference to the 3D control out so that you can use it with other VIs. | 
![]()  | 
error out contains error information. This output provides standard error out functionality. |