Owning Palette: 3D Graph Properties VIs
Requires: Base Development System (Windows)
Plots a simple surface from z matrix. The x and y vectors cause the surface to shift in relation to the x and y planes. This VI accepts one 2D array and the two optional 1D arrays.
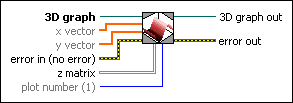
Add to the block diagram | Find on the palette |
3D graph accepts the reference to the 3D control. | |
x vector is a 1D array that describes the surface from z matrix in relation to the x plane. | |
y vector is a 1D array that describes the surface from the z matrix in relation to the y plane. | |
error in describes error conditions that occur before this node runs. This input provides standard error in functionality. | |
z matrix is a 2D array of data that determines the surface in relation to the z plane. The x and y vectors shift or skew the set of data in the z matrix. | |
plot number is the index into the list of plots from the properties of the 3D control. Add new plots by right-clicking the control and adjusting the properties. The default is the first plot from the list. | |
3D graph out passes the reference to the 3D control out so that you can use it with other VIs. | |
error out contains error information. This output provides standard error out functionality. |
x vector and y vector correspond to the two indexes for the z matrix 2D array. If the number of elements in x vector does not match the width of z matrix in the first dimension, and the number of elements in y vector does not match the width of z matrix in the second dimension, both x vector and y vector are ignored.
The values of x vector and y vector specify where the corresponding point in the z matrix should be located. The default values for x vector and y vector are 0, 1, 2, 3, and so on. The first point in z matrix (index 0,0) is located at (x vector[0], y vector[0]), or (0,0). If you change x vector to –1, 1, 2, 3, and so on, the first point in z matrix moves to (–1,0).