A histogram is a bar graph that displays frequency data and is an indication of the data distribution. A histogram provides a method for graphically displaying data and summarizing key information.
The following equation defines a data sequence.
X = {0, 1, 3, 3, 4, 4, 4, 5, 5, 8}
To compute a histogram for X, divide the total range of values into the following eight intervals, or bins:
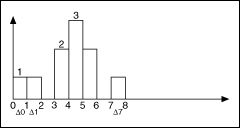
The histogram display for X indicates the number of data samples that lie in each interval, excluding the upper boundary. The following figure shows the histogram for the sequence in the previous equation.

The previous figure shows that no data samples are in the 2-3 and 6-7 intervals. One data sample lies in each of the intervals 0-1, 1-2, and 7-8. Two data samples lie in each of the intervals 3-4 and 5-6. Three data samples lie in the 4-5 interval.
The number of intervals in the histogram affects the resolution of the histogram. A common method of determining the number of intervals to use in a histogram is Sturges' Rule, which is given by the following equation.
Number of Intervals = 1 + 3.3log(size of (X))