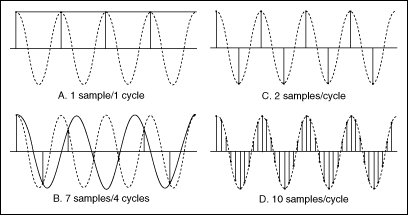
According to the Shannon Sampling Theorem, use a sampling frequency at least twice the maximum frequency component in the sampled signal to avoid aliasing. The following figure shows the effects of various sampling frequencies.

In case A of the previous figure, the sampling frequency fsequals the frequency f of the sine wave. fs is measured in samples/second. f is measured in cycles/second. Therefore, in case A, one sample per cycle is acquired. The reconstructed waveform appears as an alias at DC.
In case B of the previous figure, fs = 7/4f, or 7 samples/4 cycles. In case B, increasing the sampling rate increases the frequency of the waveform. However, the signal aliases to a frequency less than the original signal—three cycles instead of four.
In case C of the previous figure, increasing the sampling rate to fs = 2f results in the digitized waveform having the correct frequency or the same number of cycles as the original signal. In case C, the reconstructed waveform more accurately represents the original sinusoidal wave than case A or case B. By increasing the sampling rate to well above f, for example, fs = 10f = 10 samples/cycle, you can accurately reproduce the waveform.
Case D of the previous figure shows the result of increasing the sampling rate to fs = 10f.