 |
confidence level specifies the level of certainty for the confidence interval. The default is 0.95, which means the probability that the best fit falls between Lower Bound and Upper Bound is 95%. confidence level must be greater than 0 and less than 1.
|
 |
Y is the array of dependent values. The number of sample points in Y must be greater than the number of elements in Polynomial Coefficients.
|
 |
X is the array of independent values. X must be the same size as Y.
|
 |
Weight is the array of weights for the observations (X, Y). Weight must be the same size as Y. Weight also must contain non-zero elements. If an element in Weight is less than 0, the VI uses the absolute value of the element.
If you do not wire an input to Weight, the VI sets all elements of Weight to 1.
|
 |
Polynomial Coefficients specifies coefficients of the fitted model in ascending order of power. If the total number of elements in Polynomial Coefficients is m, the polynomial order is m – 1.
|
 |
Upper Bound returns the upper bound of the confidence interval.
|
 |
Lower Bound returns the lower bound of the confidence interval.
|
 |
Delta Polynomial Coefficients returns the confidence radius of Polynomial Coefficients.
|
 |
error returns any error or warning from the VI. You can wire error to the Error Cluster From Error Code VI to convert the error code or warning into an error cluster.
|
 |
confidence level specifies the level of certainty for the prediction interval. The default is 0.95, which means the probability that a new dependent value falls between Lower Bound and Upper Bound is 95%. confidence level must be greater than 0 and less than 1.
|
 |
Y is the array of dependent values. The number of sample points in Y must be greater than the number of elements in Polynomial Coefficients.
|
 |
X is the array of independent values. X must be the same size as Y.
|
 |
Weight is the array of weights for the observations (X, Y). Weight must be the same size as Y. Weight also must contain non-zero elements. If an element in Weight is less than 0, the VI uses the absolute value of the element.
If you do not wire an input to Weight, the VI sets all elements of Weight to 1.
|
 |
Polynomial Coefficients specifies coefficients of the fitted model in ascending order of power. If the total number of elements in Polynomial Coefficients is m, the polynomial order is m – 1.
|
 |
Upper Bound returns the upper bound of the prediction interval.
|
 |
Lower Bound returns the lower bound of the prediction interval.
|
 |
error returns any error or warning from the VI. You can wire error to the Error Cluster From Error Code VI to convert the error code or warning into an error cluster.
|
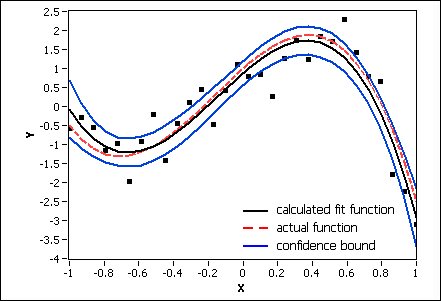
In the following illustration, the region between the upper and lower confidence bounds is the confidence interval.
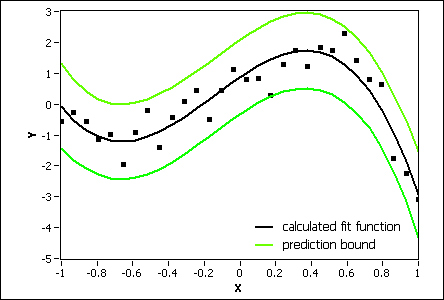
In the following illustration, the region between the upper and lower prediction bounds is the prediction interval.
 Add to the block diagram
 Find on the palette


