 |
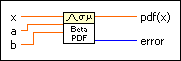
x specifies the quantile of the continuous random variate and is bounded by the interval [0, 1].
|
|
a specifies the first shape parameter of the beta variate.
|
|
b specifies the second shape parameter of the beta variate.
|
 |
pdf(x) is the probability density function at x.
|
 |
error returns any error or warning from the VI. You can wire error to the Error Cluster From Error Code VI to convert the error code or warning into an error cluster.
|
This function computes the probability density function (PDF) of the random variate X.
X represents a Cauchy-distributed variate with location parameter a, scale parameter b, and whose moments (mean and variance) are undefined.

|
x specifies the quantile of the continuous random variate.
|
|
a specifies the location parameter and median of the variate.
|
|
b specifies the scale parameter of the variate and must be greater than 0.
|
|
pdf(x) is the probability density function at x.
|
|
error returns any error or warning from the VI. You can wire error to the Error Cluster From Error Code VI to convert the error code or warning into an error cluster.
|
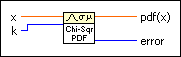
X represents a chi-squared-distributed variate with k degrees of freedom. The sum of k squared, independent, standard normal variates is distributed as a chi-squared variate with k degrees of freedom.
|
x specifies the quantile of the continuous random variate with range x ≥ 0.
|
 |
k specifies the number of degrees of freedom and must be greater than 0.
|
|
pdf(x) is the probability density function at x.
|
|
error returns any error or warning from the VI. You can wire error to the Error Cluster From Error Code VI to convert the error code or warning into an error cluster.
|
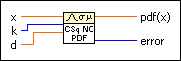
X represents a non-central chi-squared-distributed variate with k degrees of freedom and a noncentrality parameter d. The sum of k squared, independent, normal variates with a mean of d and a standard deviation of 1 is distributed as a non-central chi-squared variate with k degrees of freedom and noncentrality d.
|
x specifies the quantile of the continuous random variate with range x ≥ 0.
|
|
k specifies the number of degrees of freedom and must be greater than 0.
|
|
d specifies the noncentrality parameter, which must be greater than 0.
|
|
pdf(x) is the probability density function at x.
|
|
error returns any error or warning from the VI. You can wire error to the Error Cluster From Error Code VI to convert the error code or warning into an error cluster.
|
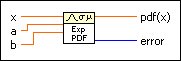
X represents an exponential-distributed variate. The exponential distribution often is used to model Poisson processes, which are situations in which an object can change from one state to another with constant probability per unit time. The scale parameter b is the mean of the distribution.
|
x specifies the quantile of the continuous random variate with range x ≥ a.
|
|
a specifies the offset parameter of the variate.
|
|
b specifies the scale parameter of the variate and must be greater than 0.
|
|
pdf(x) is the probability density function at x.
|
|
error returns any error or warning from the VI. You can wire error to the Error Cluster From Error Code VI to convert the error code or warning into an error cluster.
|
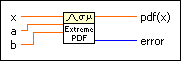
X represents an extreme value variate, which is the distribution of the largest extreme of a number of values with location parameter a and scale parameter b.
|
x specifies the quantile of the continuous random variate.
|
|
a specifies the location parameter of the variate.
|
|
b specifies the scale parameter of the variate.
|
|
pdf(x) is the probability density function at x.
|
|
error returns any error or warning from the VI. You can wire error to the Error Cluster From Error Code VI to convert the error code or warning into an error cluster.
|
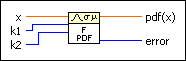
X represents an F variate, which is the ratio of two chi-squared variates. The F variate provides a basis for comparing variances between data and factors within a model, often indicating which factors cause significant variation. The k1 and k2 parameters specify the degrees of freedom of the two chi-squared variates whose ratio form the F variate.
|
x specifies the quantile of the continuous random variate with range x ≥ 0.
|
|
k1 specifies the number of degrees of freedom of the first chi-squared variate that forms the F variate. k1 must be greater than 0.
|
|
k2 specifies the number of degrees of freedom of the second chi-squared variate that forms the F variate. k2 must be greater than 0.
|
|
pdf(x) is the probability density function at x.
|
|
error returns any error or warning from the VI. You can wire error to the Error Cluster From Error Code VI to convert the error code or warning into an error cluster.
|
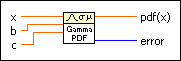
X represents a gamma-distributed variate with scale parameter b and shape parameter c. The gamma distribution includes the chi-squared, Erlang, and exponential distributions as special cases, but the value of the gamma shape parameter is not restricted to integers. The gamma variate with an integer shape parameter c is known as the Erlang variate.
|
x specifies the quantile of the continuous random variate with range x ≥ 0.
|
|
b specifies the scale parameter of the variate and must be greater than 0.
|
|
c specifies the shape parameter of the variate and must be greater than 0.
|
|
pdf(x) is the probability density function at x.
|
|
error returns any error or warning from the VI. You can wire error to the Error Cluster From Error Code VI to convert the error code or warning into an error cluster.
|
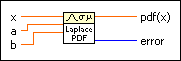
X represents a Laplace-distributed variate with location parameter a and scale parameter b.
|
x specifies the quantile of the continuous random variate.
|
|
a specifies the location or mean parameter of the variate.
|
|
b specifies the scale parameter of the variate and must be greater than 0.
|
|
pdf(x) is the probability density function at x.
|
|
error returns any error or warning from the VI. You can wire error to the Error Cluster From Error Code VI to convert the error code or warning into an error cluster.
|
X represents a logistic-distributed variate with location parameter a and scale parameter b. You can use the logistic variate to model growth.

|
x specifies the quantile of the continuous random variate.
|
|
a specifies the location or mean parameter of the variate.
|
|
b specifies the scale parameter of the variate and must be greater than 0.
|
|
pdf(x) is the probability density function at x.
|
|
error returns any error or warning from the VI. You can wire error to the Error Cluster From Error Code VI to convert the error code or warning into an error cluster.
|
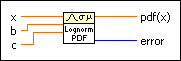
X represents a lognormal-distributed variate, which always is nonnegative and has several large values.
|
x specifies the quantile of the continuous random variate with range x ≥ 0.
|
|
b specifies the scale or median parameter of the variate and must be greater than 0.
|
|
c specifies the shape parameter of the variate and must be greater than 0.
|
|
pdf(x) is the probability density function at x.
|
|
error returns any error or warning from the VI. You can wire error to the Error Cluster From Error Code VI to convert the error code or warning into an error cluster.
|
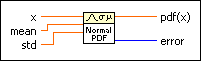
X represents a normally-distributed variate with location parameter mean and scale parameter std. The normal continuous distribution is the most commonly used distribution in statistics and is the asymptotic form of the sum of random variables under a wide range of conditions.
|
x specifies the quantile of the continuous random variate.
|
|
mean specifies the location or mean parameter of the variate.
|
|
std specifies the scale or standard deviation parameter of the variate and must be greater than 0.
|
|
pdf(x) is the probability density function at x.
|
|
error returns any error or warning from the VI. You can wire error to the Error Cluster From Error Code VI to convert the error code or warning into an error cluster.
|
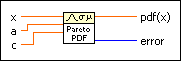
X represents a Pareto-distributed variate with location parameter a and shape parameter c. You can use the Pareto distribution to model the distribution of the number of people with an income less than x. The Pareto distribution often is associated with the "80/20" rule.
|
x specifies the quantile of the continuous random variate with range x ≥ a.
|
|
a specifies the location parameter and must be greater than 0.
|
|
c specifies the shape parameter of the variate and must be greater than 0.
|
|
pdf(x) is the probability density function at x.
|
|
error returns any error or warning from the VI. You can wire error to the Error Cluster From Error Code VI to convert the error code or warning into an error cluster.
|
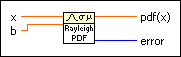
X represents a Rayleigh-distributed variate with scale parameter b. The RMS sum of two independent, standard, normal variates is a Rayleigh-distributed variate.
|
x specifies the quantile of the continuous random variate with range x ≥ 0.
|
|
b specifies the scale parameter of the variate and must be greater than 0.
|
|
pdf(x) is the probability density function at x.
|
|
error returns any error or warning from the VI. You can wire error to the Error Cluster From Error Code VI to convert the error code or warning into an error cluster.
|
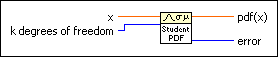
X represents a Student's t-distributed variate with k degrees of freedom. You can use the Student's t-distribution to test whether two samples came from the same normal population or whether the differences between the means of two samples is statistically significant.
|
x specifies the quantile of the continuous random variate.
|
|
k degrees of freedom specifies the number of degrees of freedom and must be greater than 0.
|
|
pdf(x) is the probability density function at x.
|
|
error returns any error or warning from the VI. You can wire error to the Error Cluster From Error Code VI to convert the error code or warning into an error cluster.
|
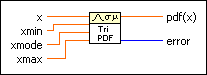
X represents a triangular-distributed variate with lower limit xmin, upper limit xmax, and mode xmode.
|
x specifies the quantile of the continuous random variate and is bounded by the interval [xmin, xmax].
|
|
xmin specifies the lower limit parameter of the variate.
|
|
xmode specifies the mode parameter of the variate. The default is NaN, which corresponds to a mode at the midpoint between xmin and xmax.
|
|
xmax specifies the upper limit parameter of the variate.
|
|
pdf(x) is the probability density function at x.
|
|
error returns any error or warning from the VI. You can wire error to the Error Cluster From Error Code VI to convert the error code or warning into an error cluster.
|
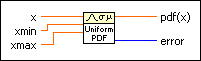
X represents a continuous uniform-distributed variate such that every value in the range of x, as defined by the interval [xmin, xmax], is equally likely to occur. Uniform random numbers typically follow this distribution. The continuous uniform distribution serves as the basis of the generation of random numbers from other statistical distributions.
|
x specifies the quantile of the continuous random variate and is bounded by the interval [xmin, xmax].
|
|
xmin specifies the lower limit parameter of the variate.
|
|
xmax specifies the upper limit parameter of the variate.
|
|
pdf(x) is the probability density function at x.
|
|
error returns any error or warning from the VI. You can wire error to the Error Cluster From Error Code VI to convert the error code or warning into an error cluster.
|
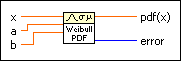
X represents a Weibull-distributed variate with scale parameter a and shape parameter b. You can use the Weibull distribution as a lifetime distribution to study reliability.
|
x specifies the quantile of the continuous random variate with range x ≥ 0.
|
|
a specifies the location parameter and must be greater than 0.
|
|
b specifies the shape parameter of the variate and must be greater than 0.
|
|
pdf(x) is the probability density function at x.
|
|
error returns any error or warning from the VI. You can wire error to the Error Cluster From Error Code VI to convert the error code or warning into an error cluster.
|
Refer to the Display Continuous Probability Distributions VI in the labview\examples\Mathematics\Probability and Statistics directory for an example of using the Continuous PDF VI.
 Open example
  Find related examples
 Add to the block diagram